
Data Studio + Data Blending: Check if your migration went well
Coming out of a migration ? Easily check if it went well with data blending in Data Studio
Requirements:
- A Google Account
- A HTTPS or domain change migration (you need 2 Search Console)
- Old site Search Console
- New Search Console
dashboard Objectives:
-
- Check and monitor your migration
- Visualize in a single chart your clicks evolution for the old & new site
- Have a simple and fit to be seen chart for you and your clients
Good to know:
-
- I cannot connect the client Search Console to the dashboard so the following data is generated in a spreadsheet
- You’ll get the exact same results while using the Search Console connector on your websites (however, in our case the date range will be fixed between the 22/02/2019 and 19/03/2019)
Résultat final
Data Blending in Data Studio
Data blending in Data Studio allows you to join different data sources in order to regroup them in the same chart / table. In order to blend data, your data sources need to have at least one dimension in common which is called a join key.
Below you can find an example where I blended a data source from Google Analytics and one from Search Console. The join key between the two being the country.
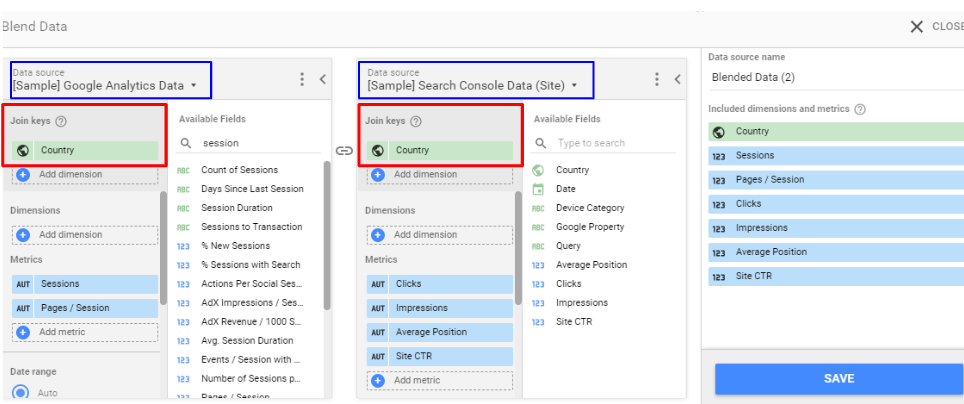
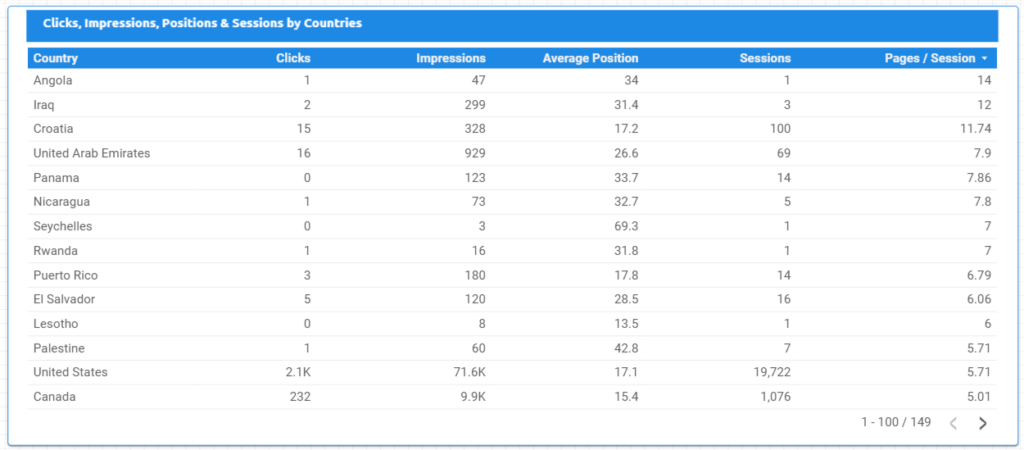
In the same table we display:
- Search Console data: clics, impressions, positions and CTR
- Google Analytics data: sessions and pages/session
Not necessarily the most interesting data blending but it will display the average position, clicks per session in a given country. If you wanna know more about data blending check here.
monitor your migration with data blending
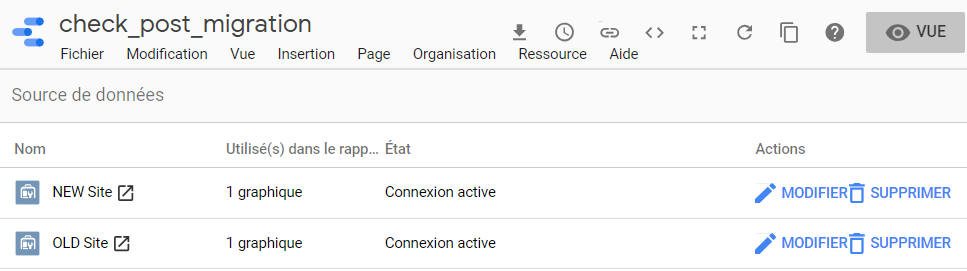
Let’s take a domain name change as an example, in order to monitor our migration let’s blend the data from our old Search Console with the new. To do so:
- Add the 2 Search Console data sources to your report:
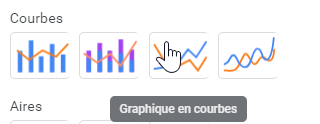
- Choose line chart and click on data blending
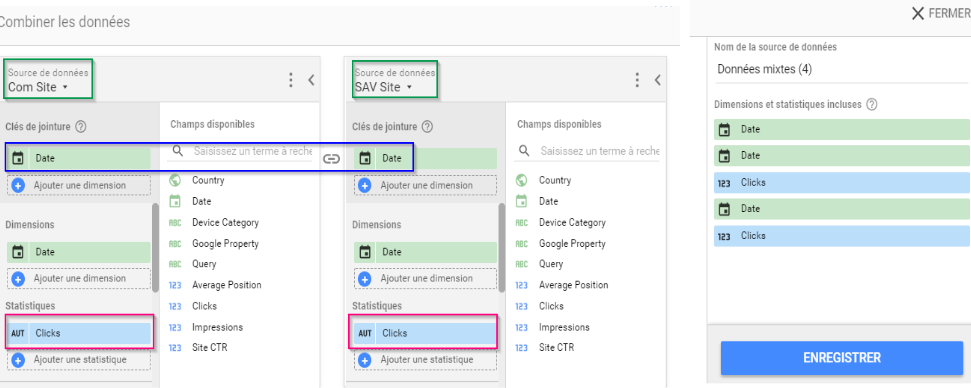
- Choose the 2 Search Console data sources (Site) you want to blend + the data you want to see on the chart, in our case the clicks
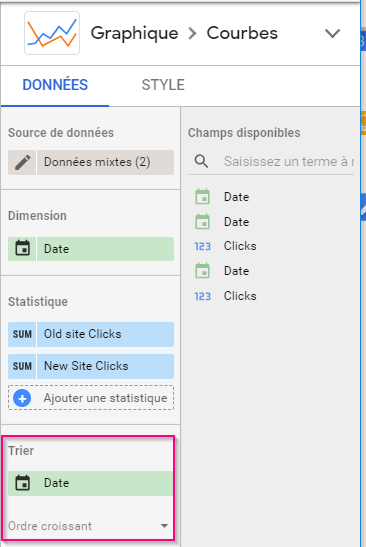
- Do not forget to sort by ascending date, otherwise you’ll get a weird chart
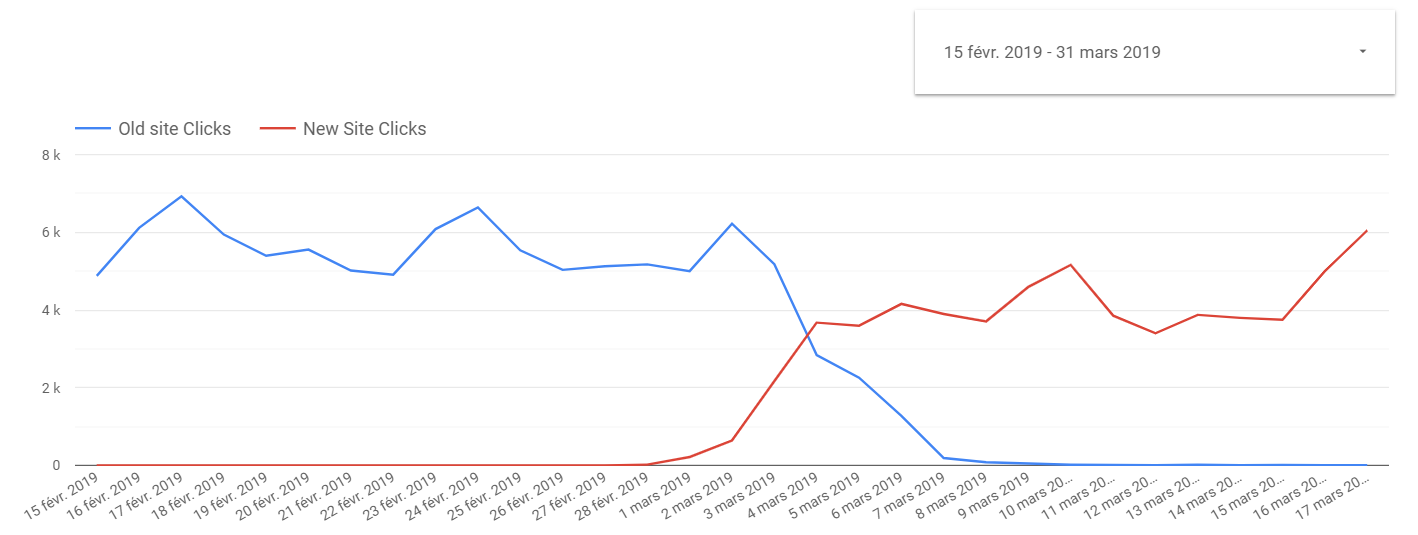
- Now you just have to analyze the final result
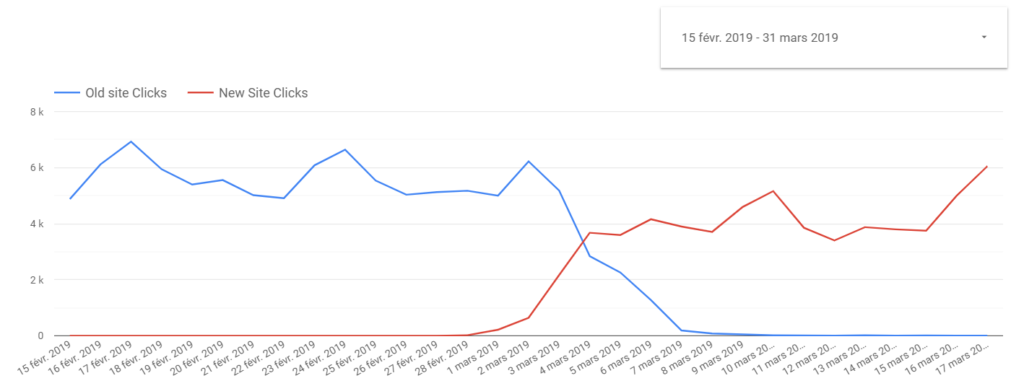
In our case, we can see that the name change went well and that 2 to 3 weeks were necessary to recover a close level of clicks number.
Wrapping it up
Data blending can be used for way more advanced analysis, however by simply blending data from 2 Search Console after your migration you can monitor it and see how quickly your website recovers.