Data Studio + Search Console : Building a Free Keyword Ranking Dashboard
Create a free keyword tracking / ranking dashboard with Data Studio and Google Search Console and monitor your positions over time.
Requirements:
- A Google account
- A Search Console account with data
Dashboard Objectives:
- Track and monitor your queries
- Track your rankings’ evolution in time series charts
- Focus / Highlight some specific queries rankings evolution in those charts

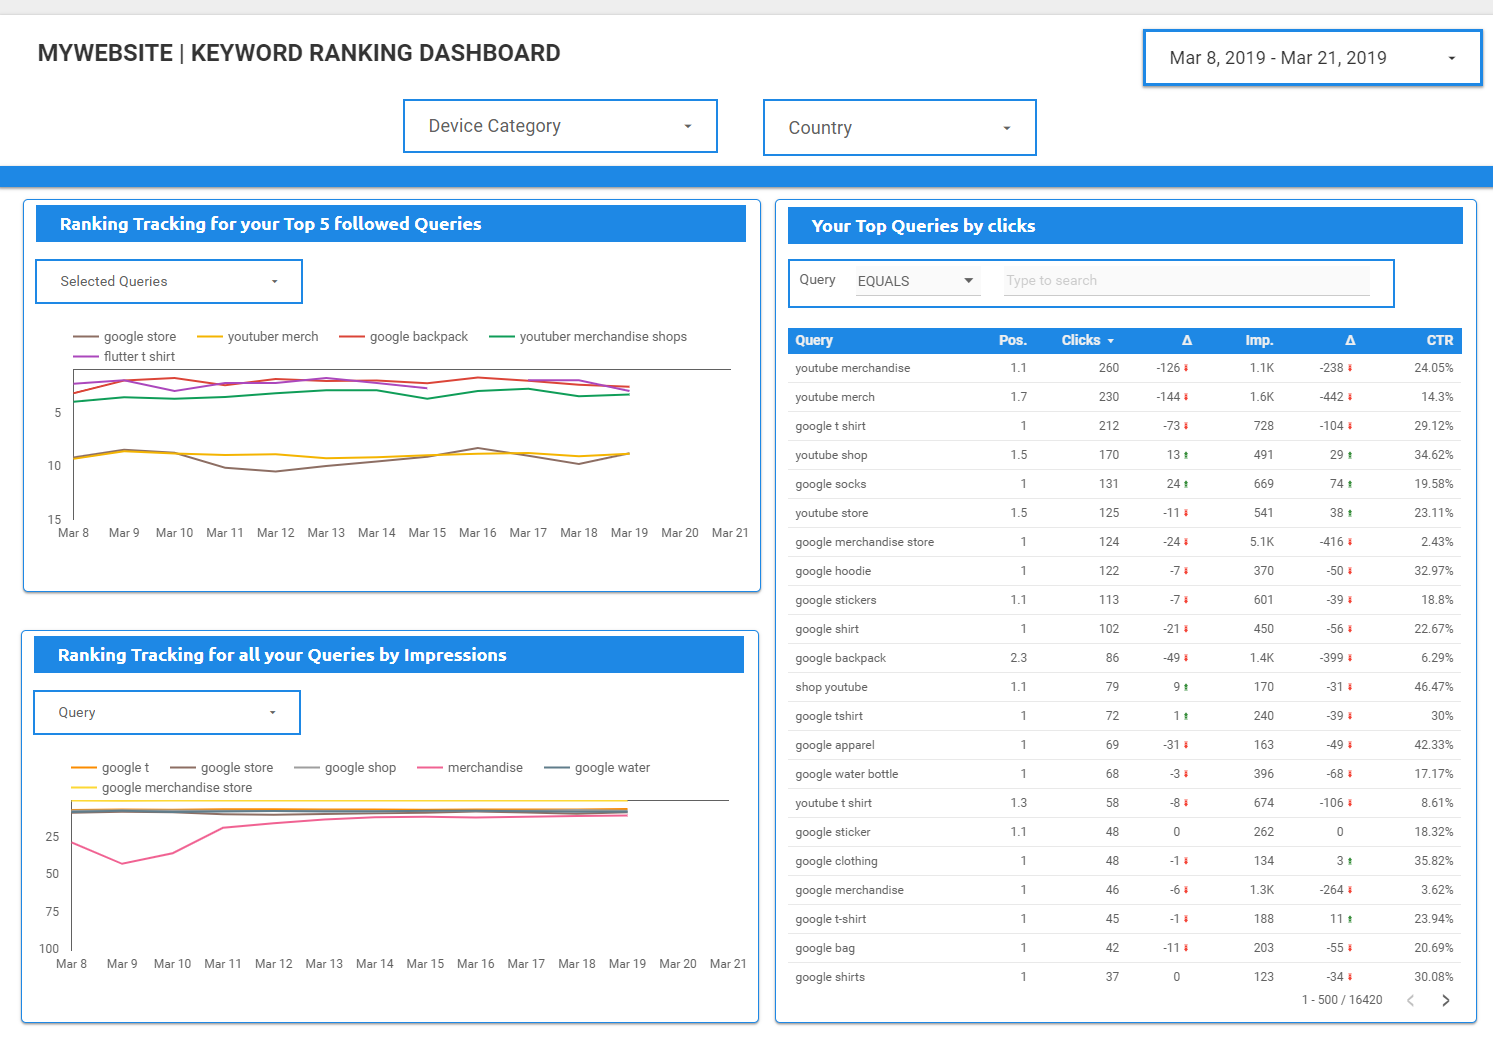
Final Result
The interesting parts of this Dashboard are the 2 time series charts which allow us to track the ranking evolution of one or several queries at the same time. The table is just here to list all of our queries and their KPIs (clicks, impressions and CTR).
Charts and Filters
Step 1: Adding data source and chart
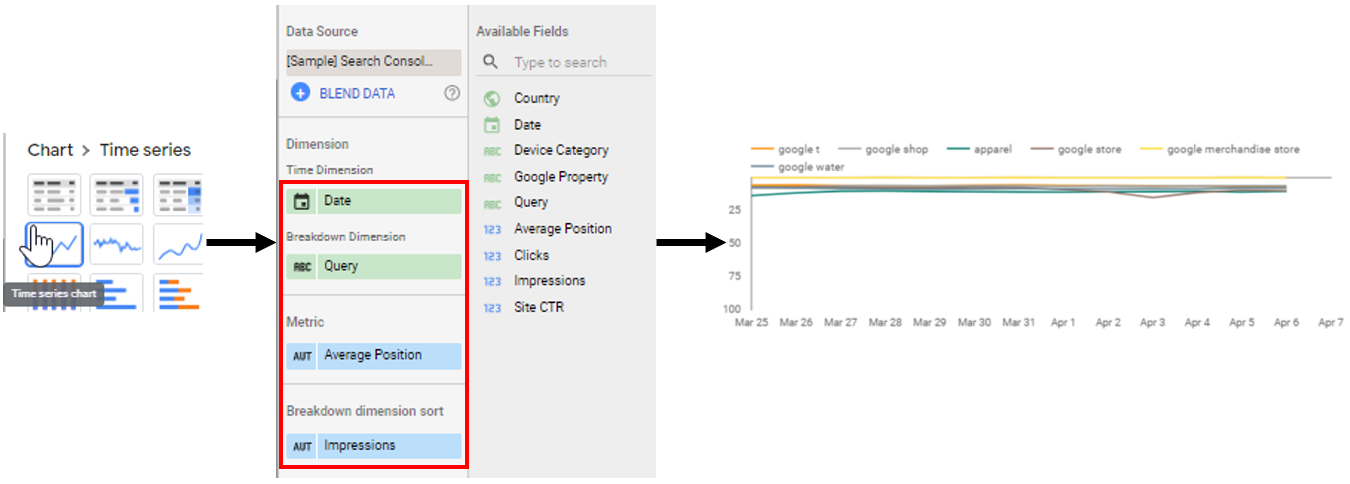
Once you’ve added your Search Console data source (Site), you need to select a time series chart since we’re going to use dates.

Chart displaying the rankings over time for the top 6 queries (by impressions).
You can choose to order your queries by clicks or impressions. I find it more interesting to order by impressions as it shows queries where you’re the most visible but not necessarily the most clicked, so the ones where there is work to do.
Step 2: Adding Filter Control
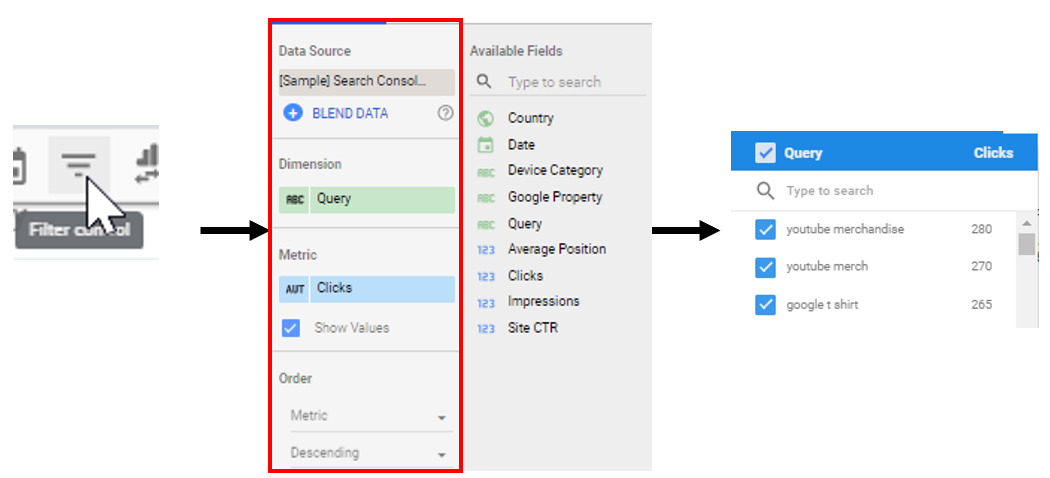
Now that our chart is created, you need to add a filter control so you can select the queries we want to display in it.

You can order the displayed queries by clicks or impressions
With this new created filter you can display only one query or several in the same chart. This will allow you to keep track of your position over time and compare queries between each other. Do not forget to regroup (select the chart & filter control -> right click -> “regroup”) your chart and your filter so the latter does not apply on other charts on your dashboard.
Over time position tracking for the query “google store”
Focusing on selected queries in the chart
By default, the previous chart will display your queries by clicks / impressions but if you want to focus on a bunch of queries you’ve selected you can configure your filter so it only displays those queries. This can be super useful if you want to focus on certain top queries or queries you’re currently working on.
Same graph as before but we only display the 5 queries we want to focus on
Step 1: Chart
First, you just need to copy paste the graph and the filter control we’ve created before.
Step 2: Adding a REGEX with your queries
In order to display only some queries (I would advice only to show a maximum of 5 queries for better readability), you just need to add the following REGEX in your chart and filter control (in the filter section).

The following REGEX will only include your selected queries
You just need to change the following keywords by the ones you want to track.
^youtuber merch$|^google backpack$|^google store$|^youtuber merchandise shops$|^flutter t shirt$
Remarques :
- ^ is indicate the beginning of what we want to include, in other words “begins with…“
- $ indicates the end of what we want to include, in other words “is ending by“
- | means ”or” and is used to include more words to take into account
Here, we are matching our exact queries with the REGEX. Note that with Data Studio, REGEX have different synthaxes than other tools.
Wrapping it up
The Data Studio and Search Console association allows you to create a keyword tracking dashboard without using an external tool (AWR, Monitorank, etc..). The main benefits are:
- it’s free
- almost real time / daily (1 or 2 days gap)
- average position for a keyword (if you have several URLs ranking on 1 keyword, you’ll have an average for the position)
